
Retrace · B2B SaaS · Shipped
ERA Reporting Dashboard
One screen that tells a multi-clinic admin which payers still owe them a response.
Problem
Every claim a clinic submits should come back with an ERA. Admins running a hundred clinics had no way to see which ones hadn't, so they couldn't confirm what they were still owed.
What I designed
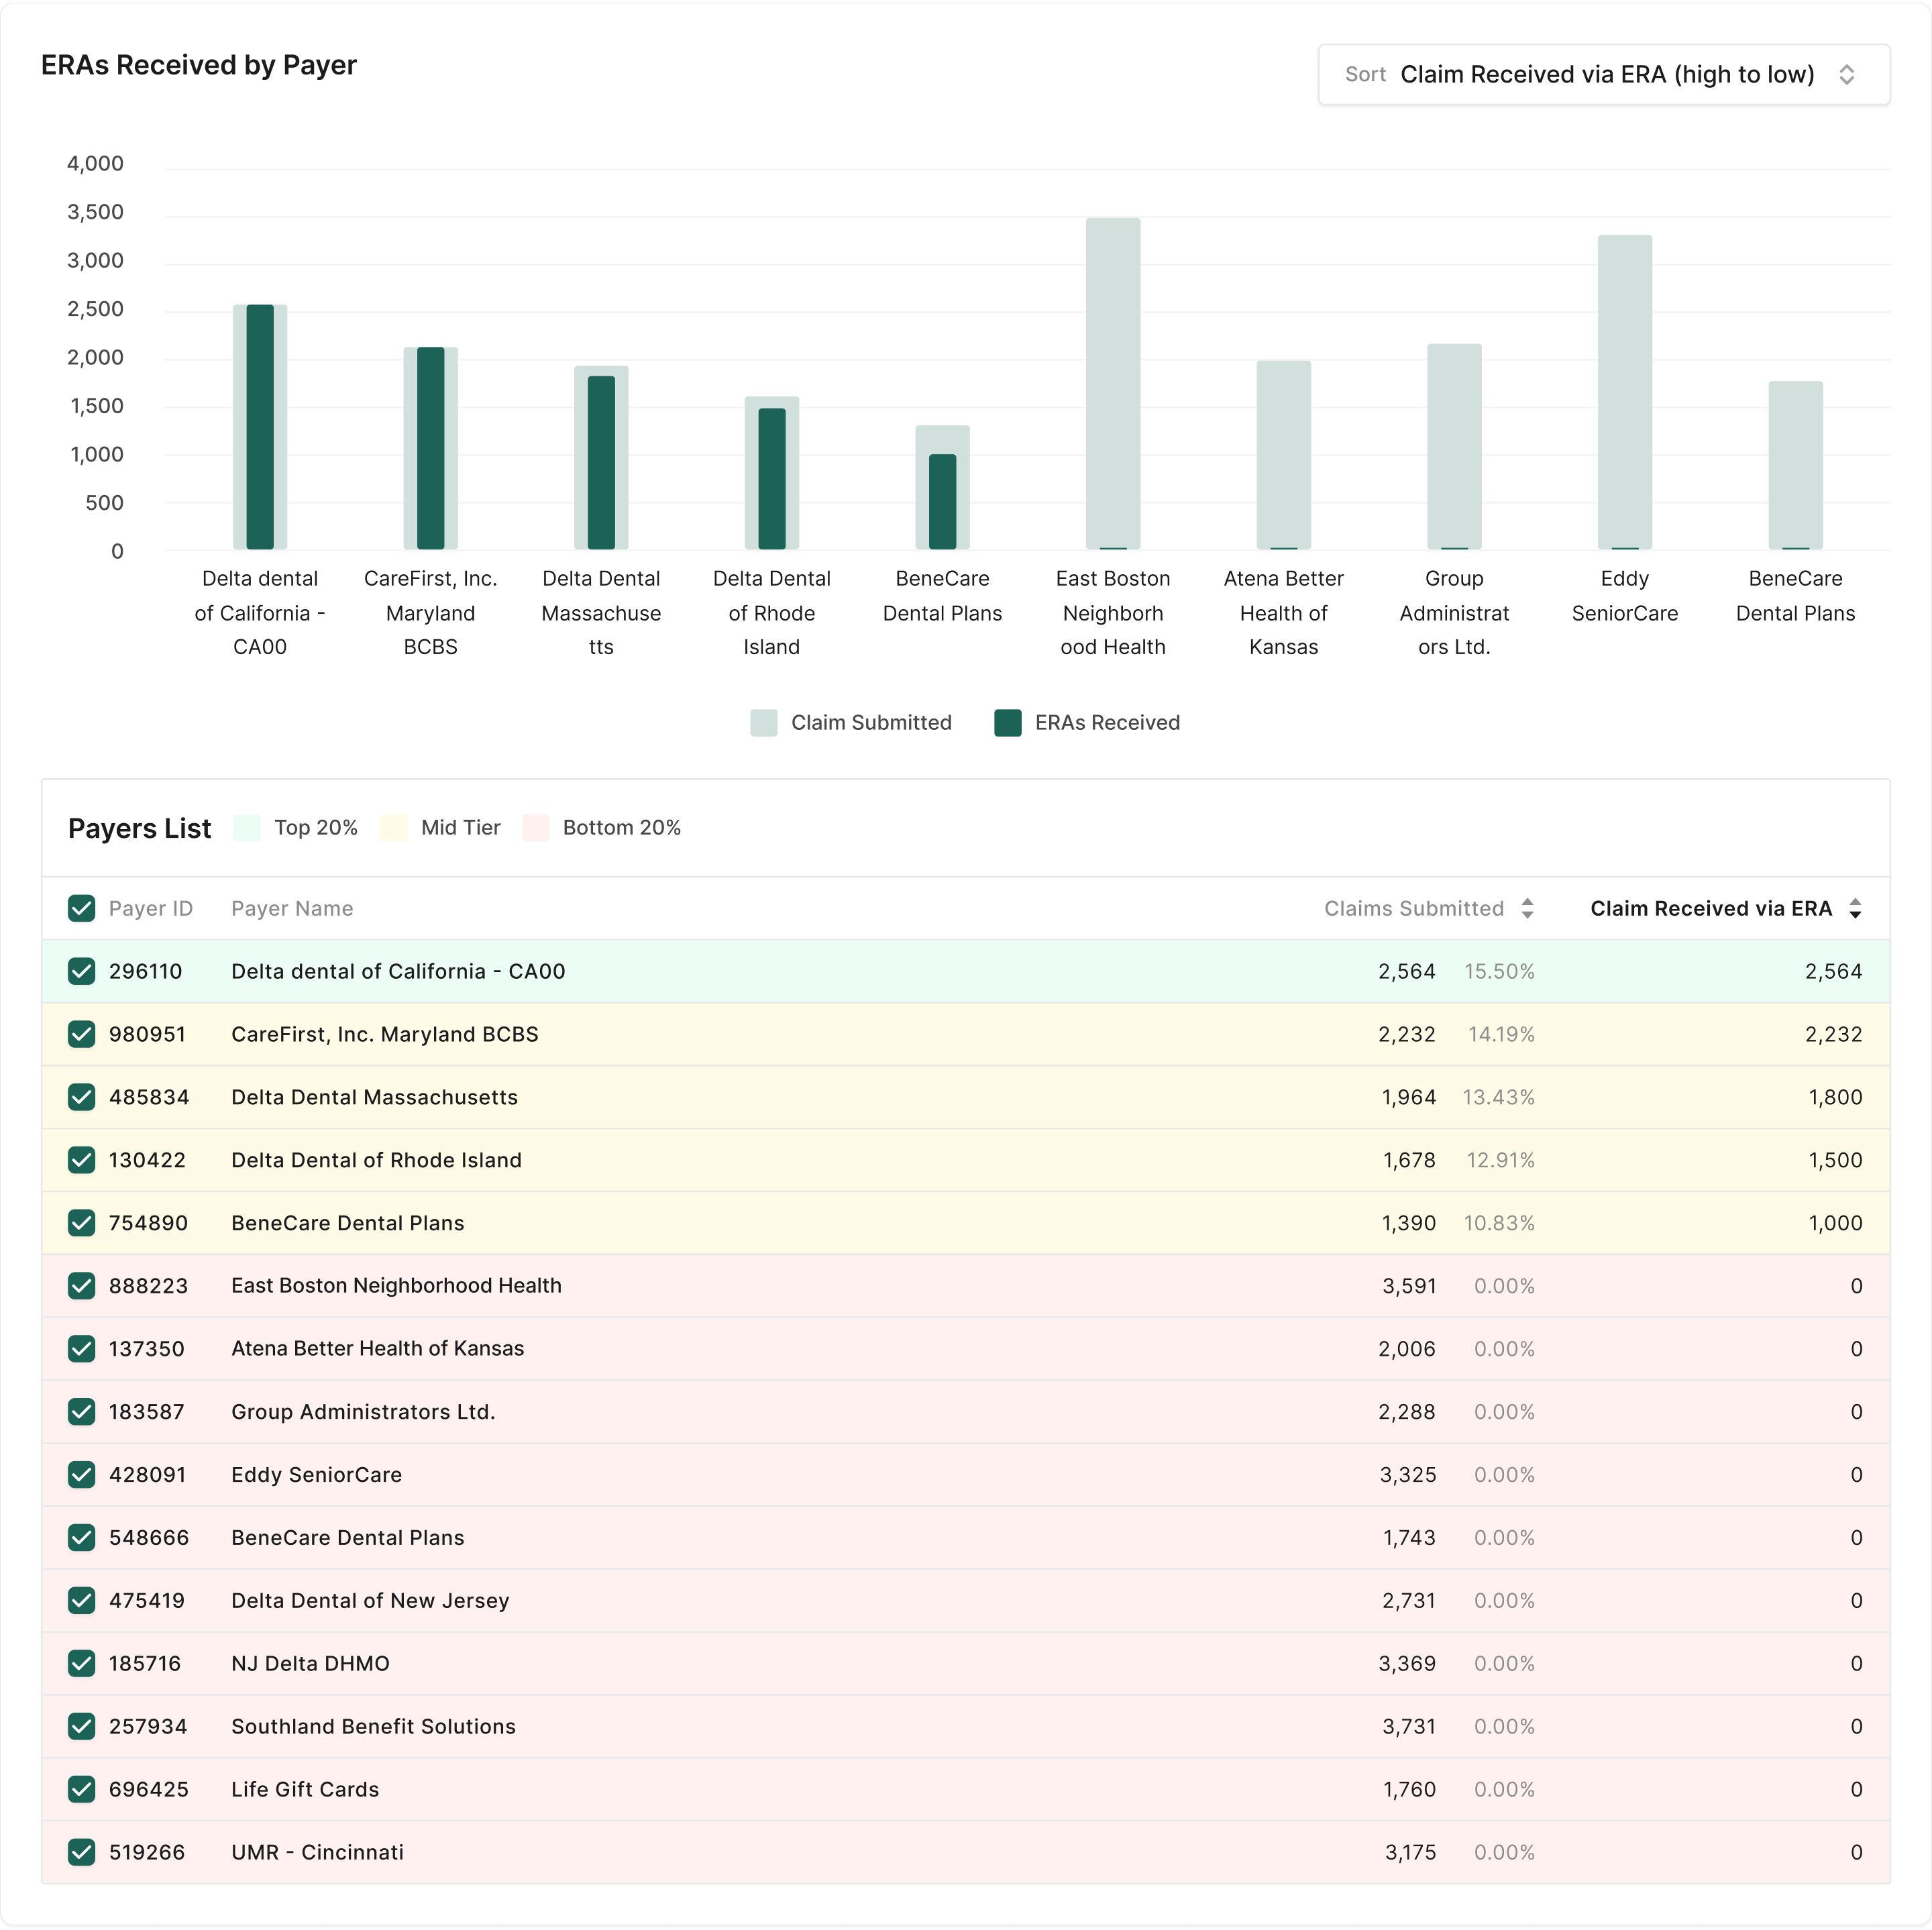
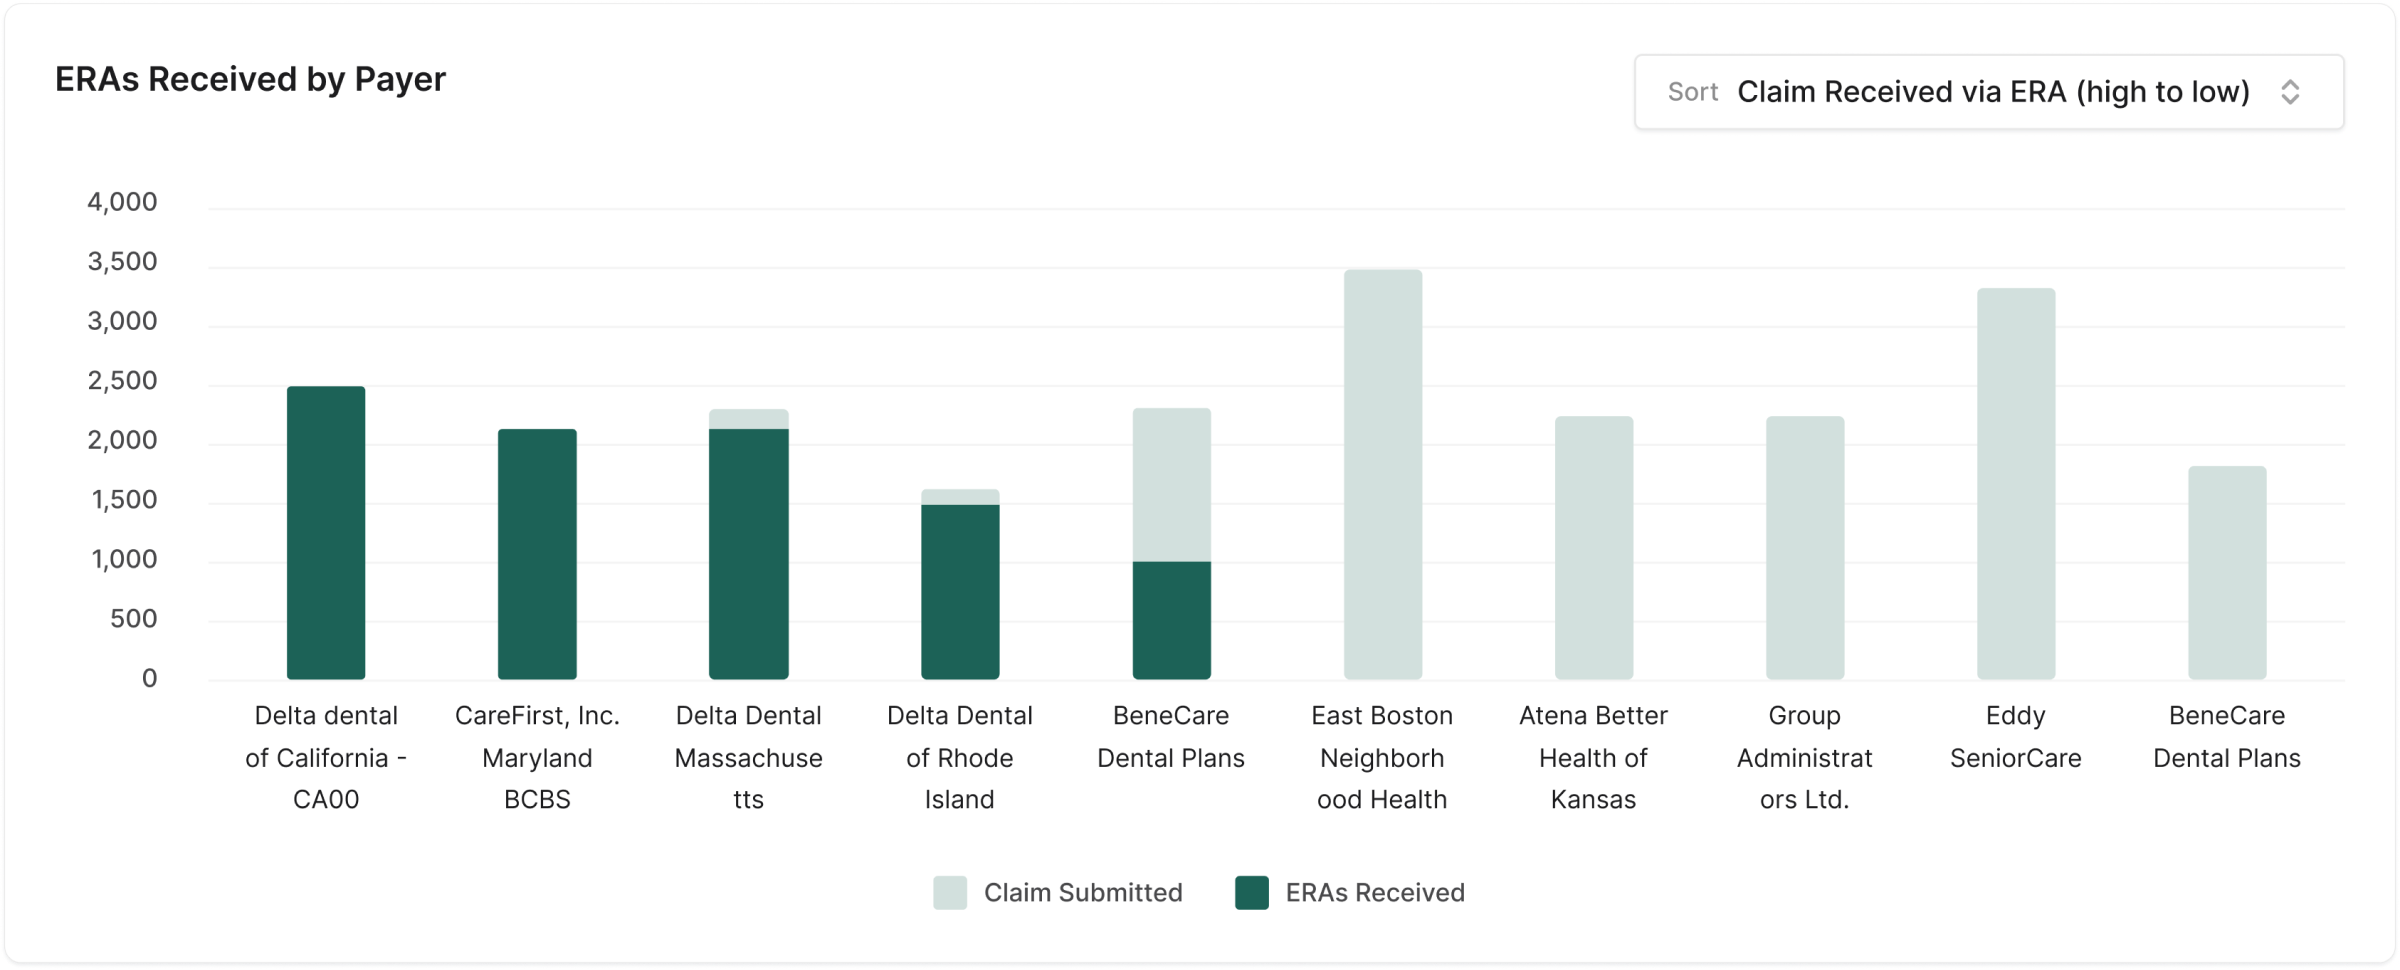
I explored four ways to slice the data, then converged on a payer view: a bar-inside-a-bar chart that makes the gap between claims sent and ERAs received visible, over a sortable, colour-tiered payer list.
What changed
Shipped. An admin can now answer three questions by sorting one list: who do we bill most, who responds most, and who is sitting on our claims.
No percentage claims here. We didn't baseline the old process, so the closing section covers how I'd measure it.
Quick look
The shipped design
Context
A claim goes out. An ERA should come back.
Retrace is a billing platform for dental practices. It creates the insurance claim after a treatment and sends it through a clearinghouse to the payer. The payer processes it and returns an Electronic Remittance Advice (ERA), which is how the clinic confirms it has been reimbursed.

For a single clinic, checking that loop is tedious but possible. The users here are admins of dental groups. They look after a large number of clinics, often more than a hundred, each receiving many ERAs from many payers. At that scale, “did every claim get its ERA?” can't be answered by looking at files.
Too much data
The raw volume of ERA records was more than anyone could read.
Nothing stood out
No indicator separated a healthy payer or clinic from a problem one.
Slow to work through
Tracking meant stepping through a complex system record by record.
Hard to decide
With no organised view, deciding where to act first was guesswork.
Goals
What the dashboard had to do
01
Make tracking simple across every clinic an admin manages.
02
Turn records into pictures that can be read in seconds.
03
Point at the problems so the admin knows where to act first.
04
Stay easy to use for people whose job is operations, not analytics.
Constraint
Designing inside a chart library
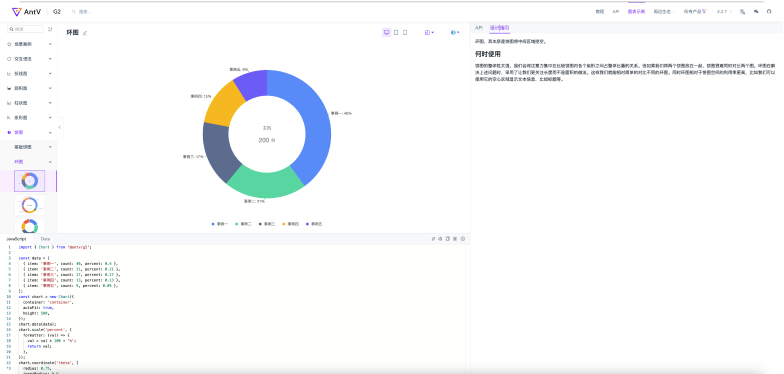
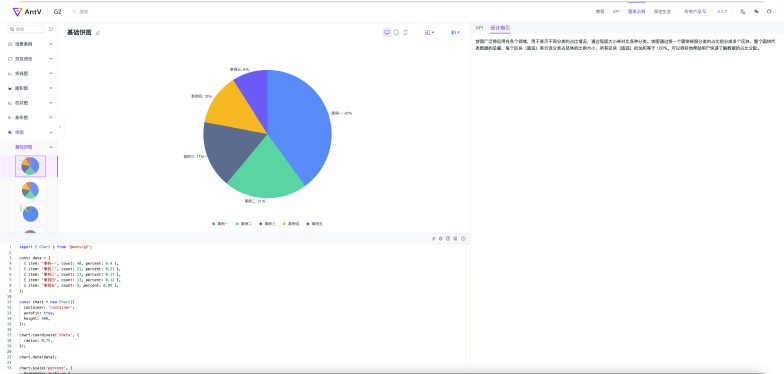
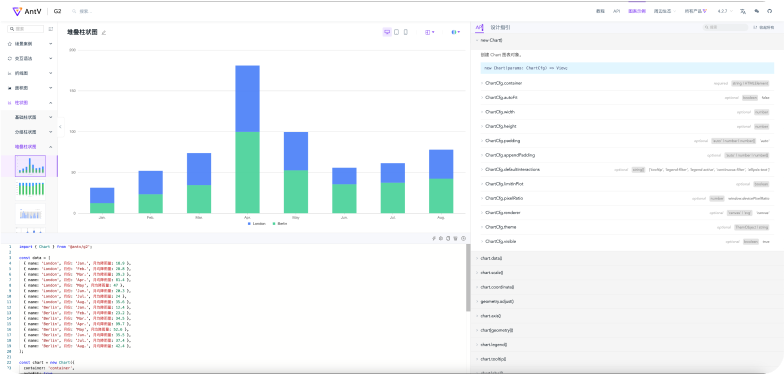
The chart library decides what's cheap to build and what's expensive. We chose AntV G2 for its range and how far each chart could be customised. Early on, I went through its catalogue to learn which chart types and interactions we could get close to for free, so I could design with engineering's costs in mind.

Explorations
Three lenses on the same data
ERA data can be organised by time, by payer, or by clinic. Each lens answers a different question, so I designed all three before choosing.
Option 1
View by time
A donut shows the overall health of ERA files, green for healthy and red for needs attention. A stacked bar chart shows volume and status month by month across a year.
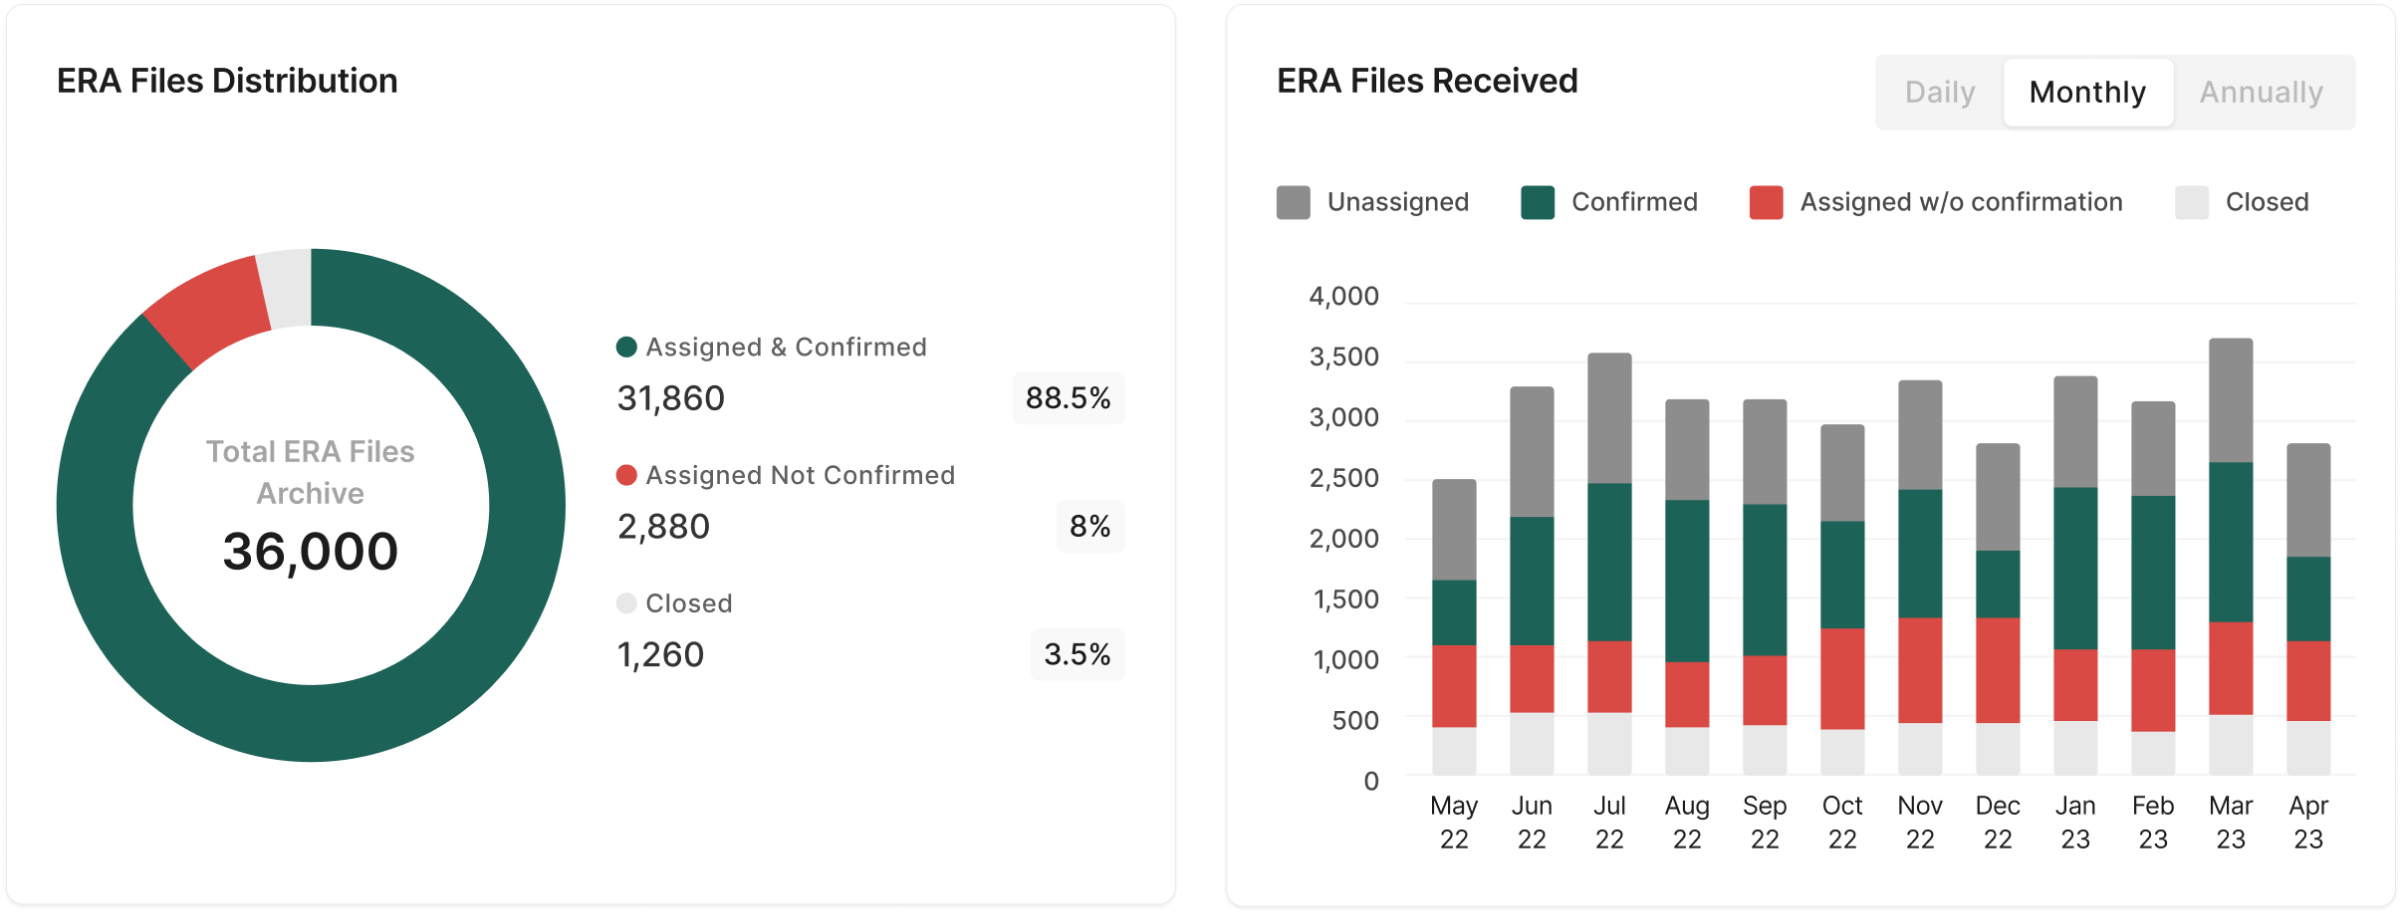
Good for: noticing that something has changed. Weak at: telling you who to call about it.
Option 2
View by payer
First as horizontal stacked bars, which keep long payer names readable and break each payer's ERAs into unassigned, confirmed, unconfirmed and closed.
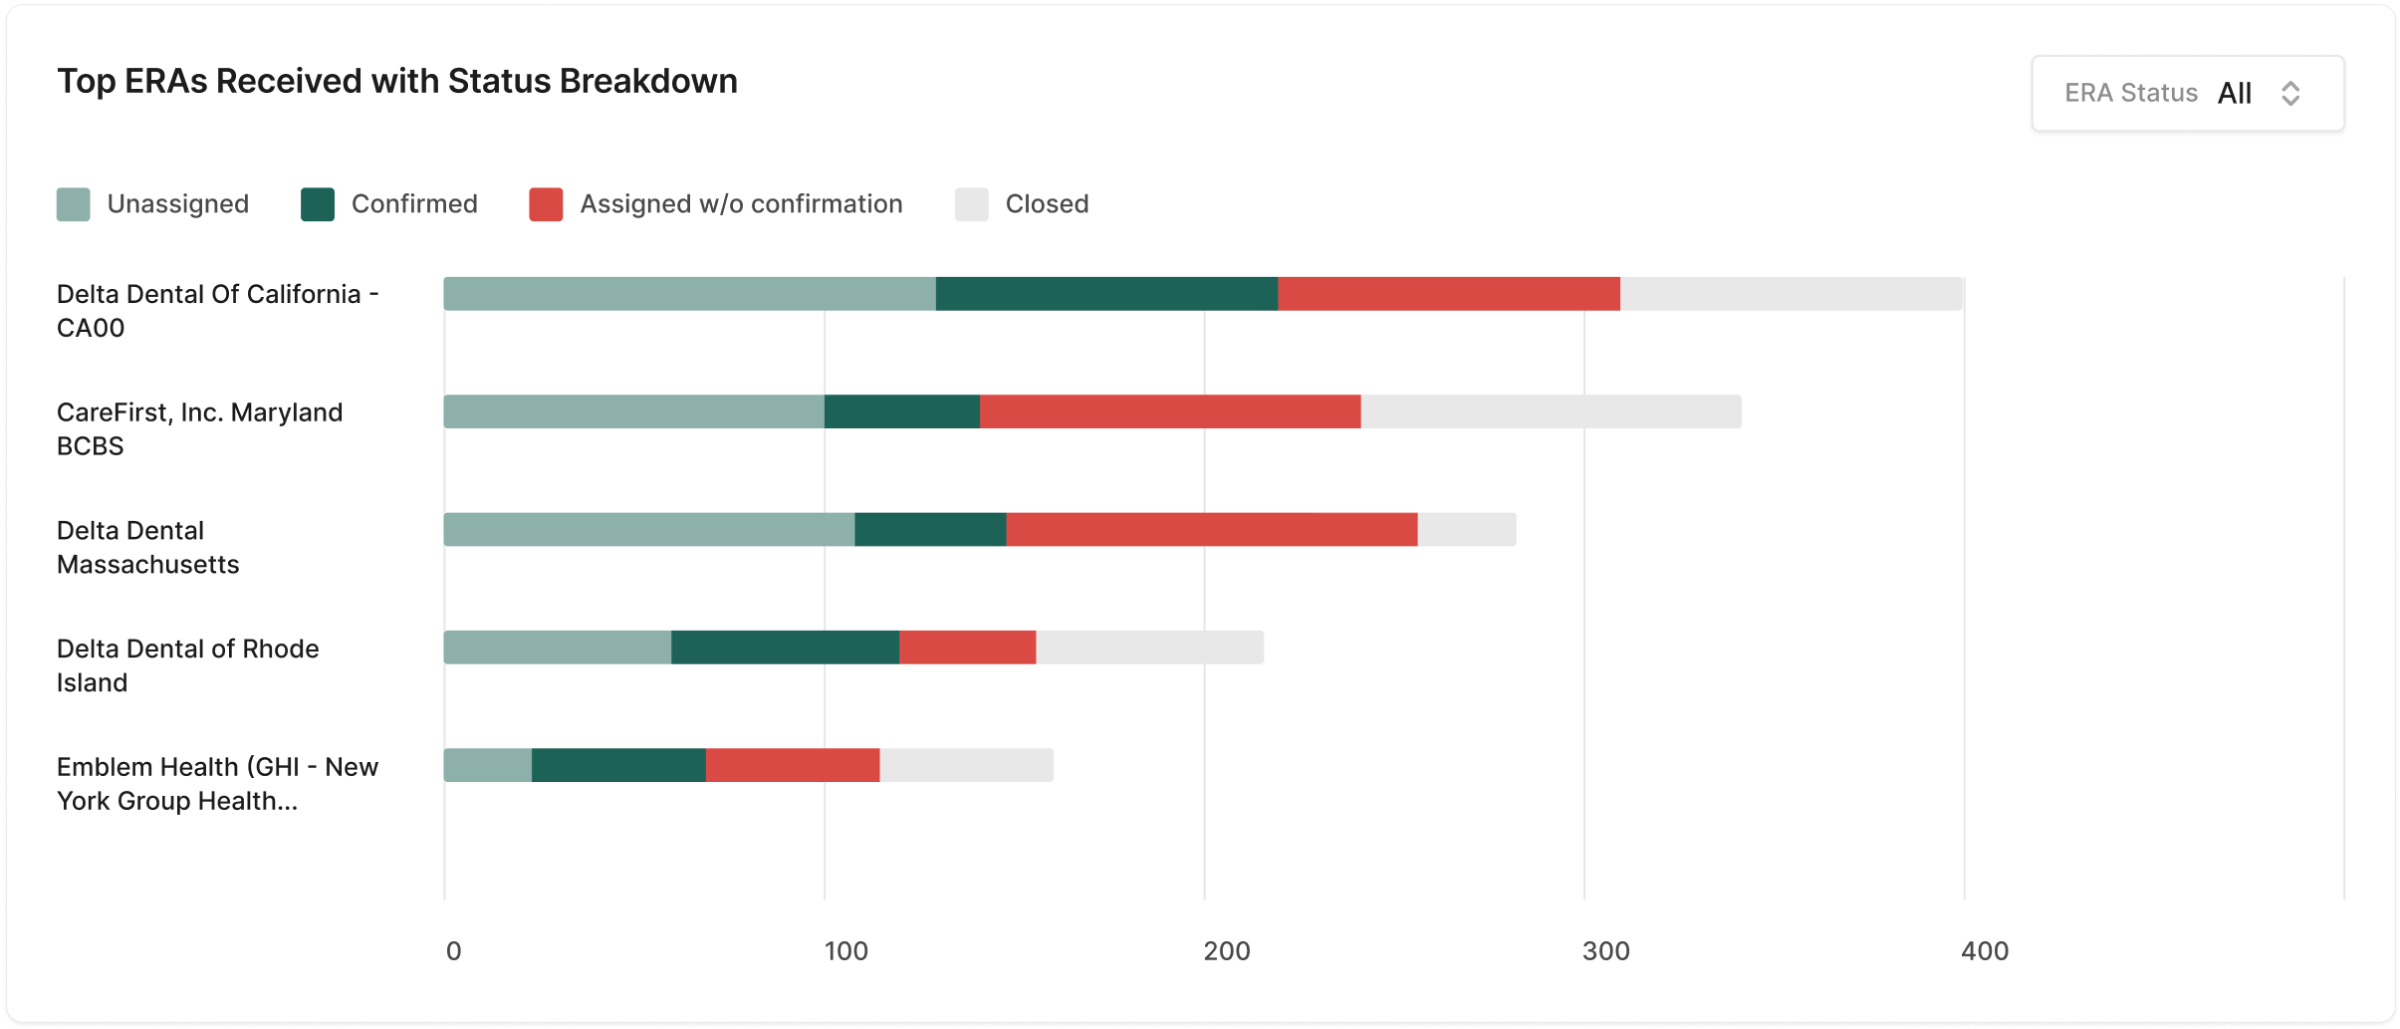
Then as vertical bars over time, with one consistent colour per payer, plus a doughnut for the value of claims with no ERA yet.
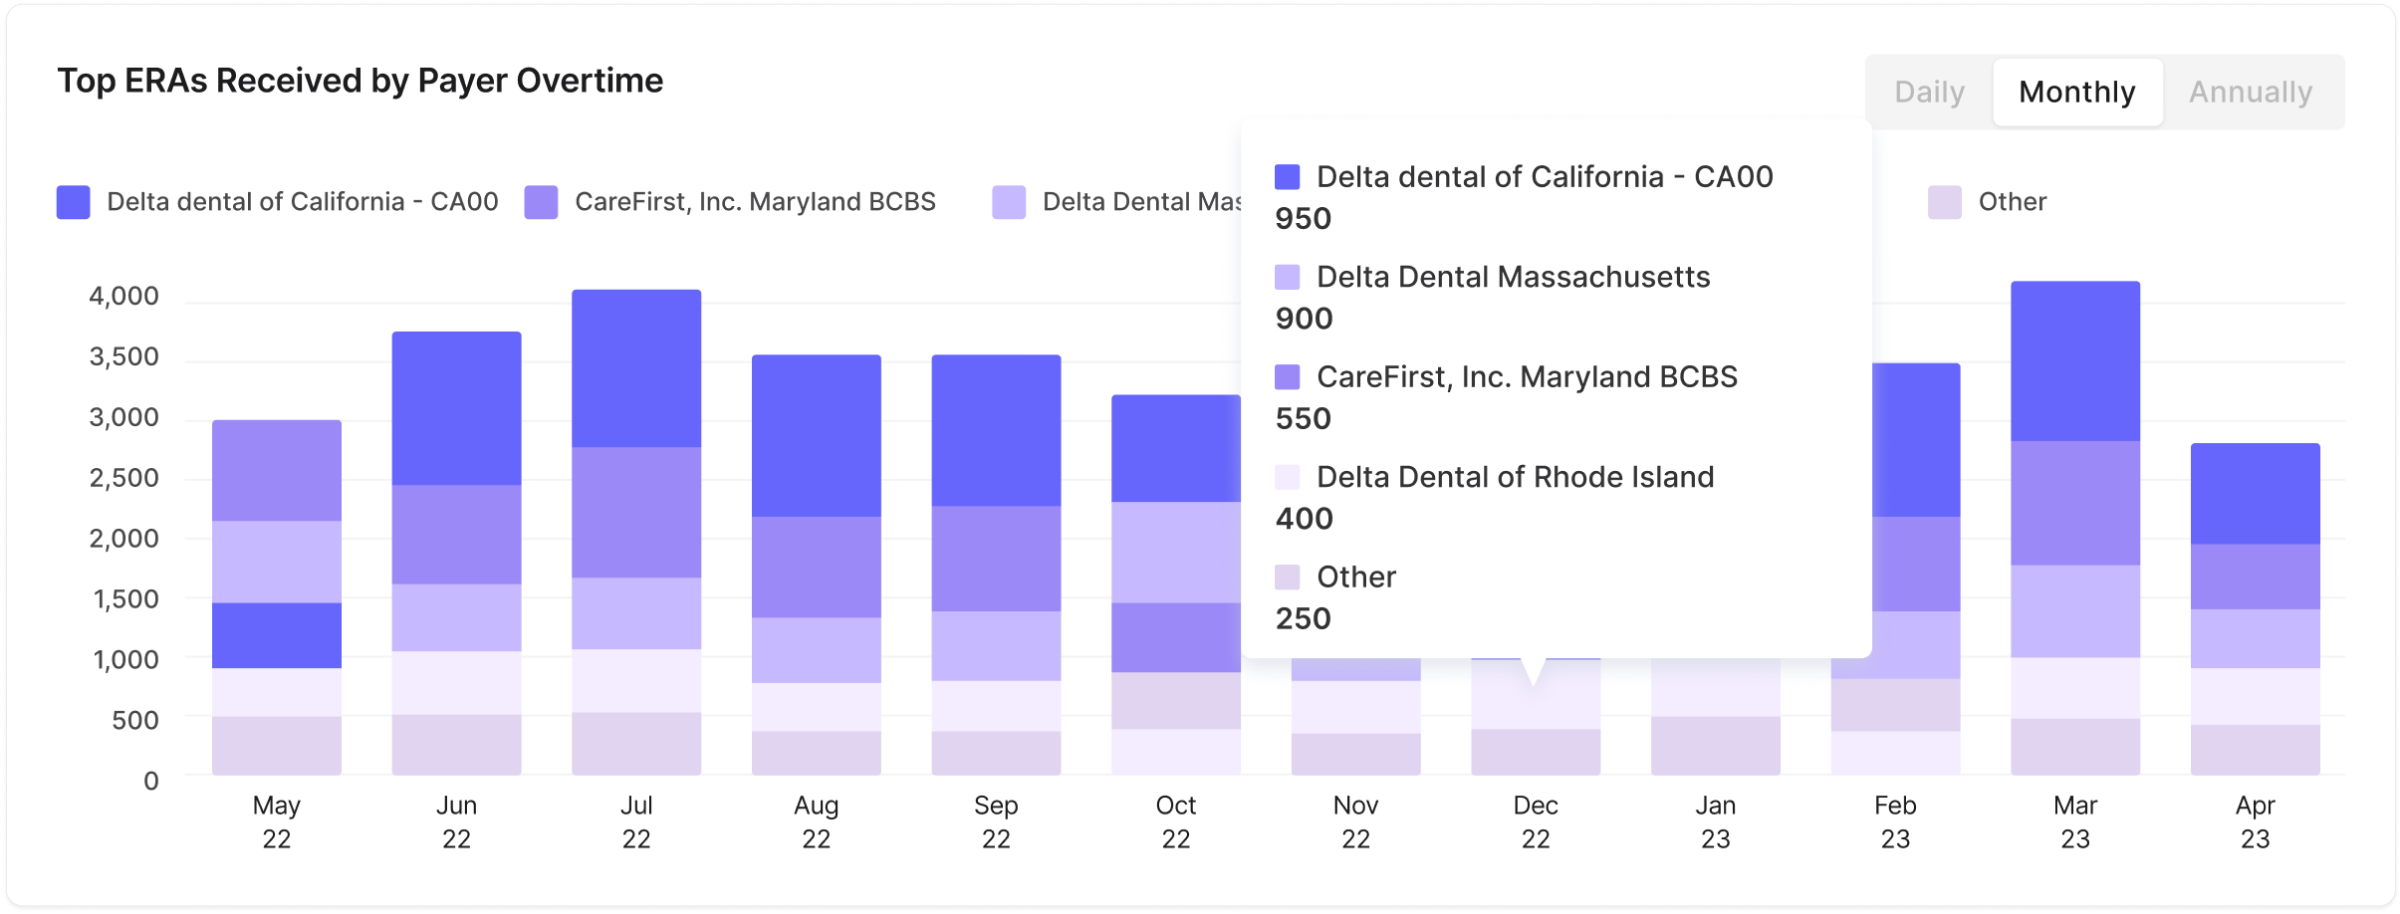
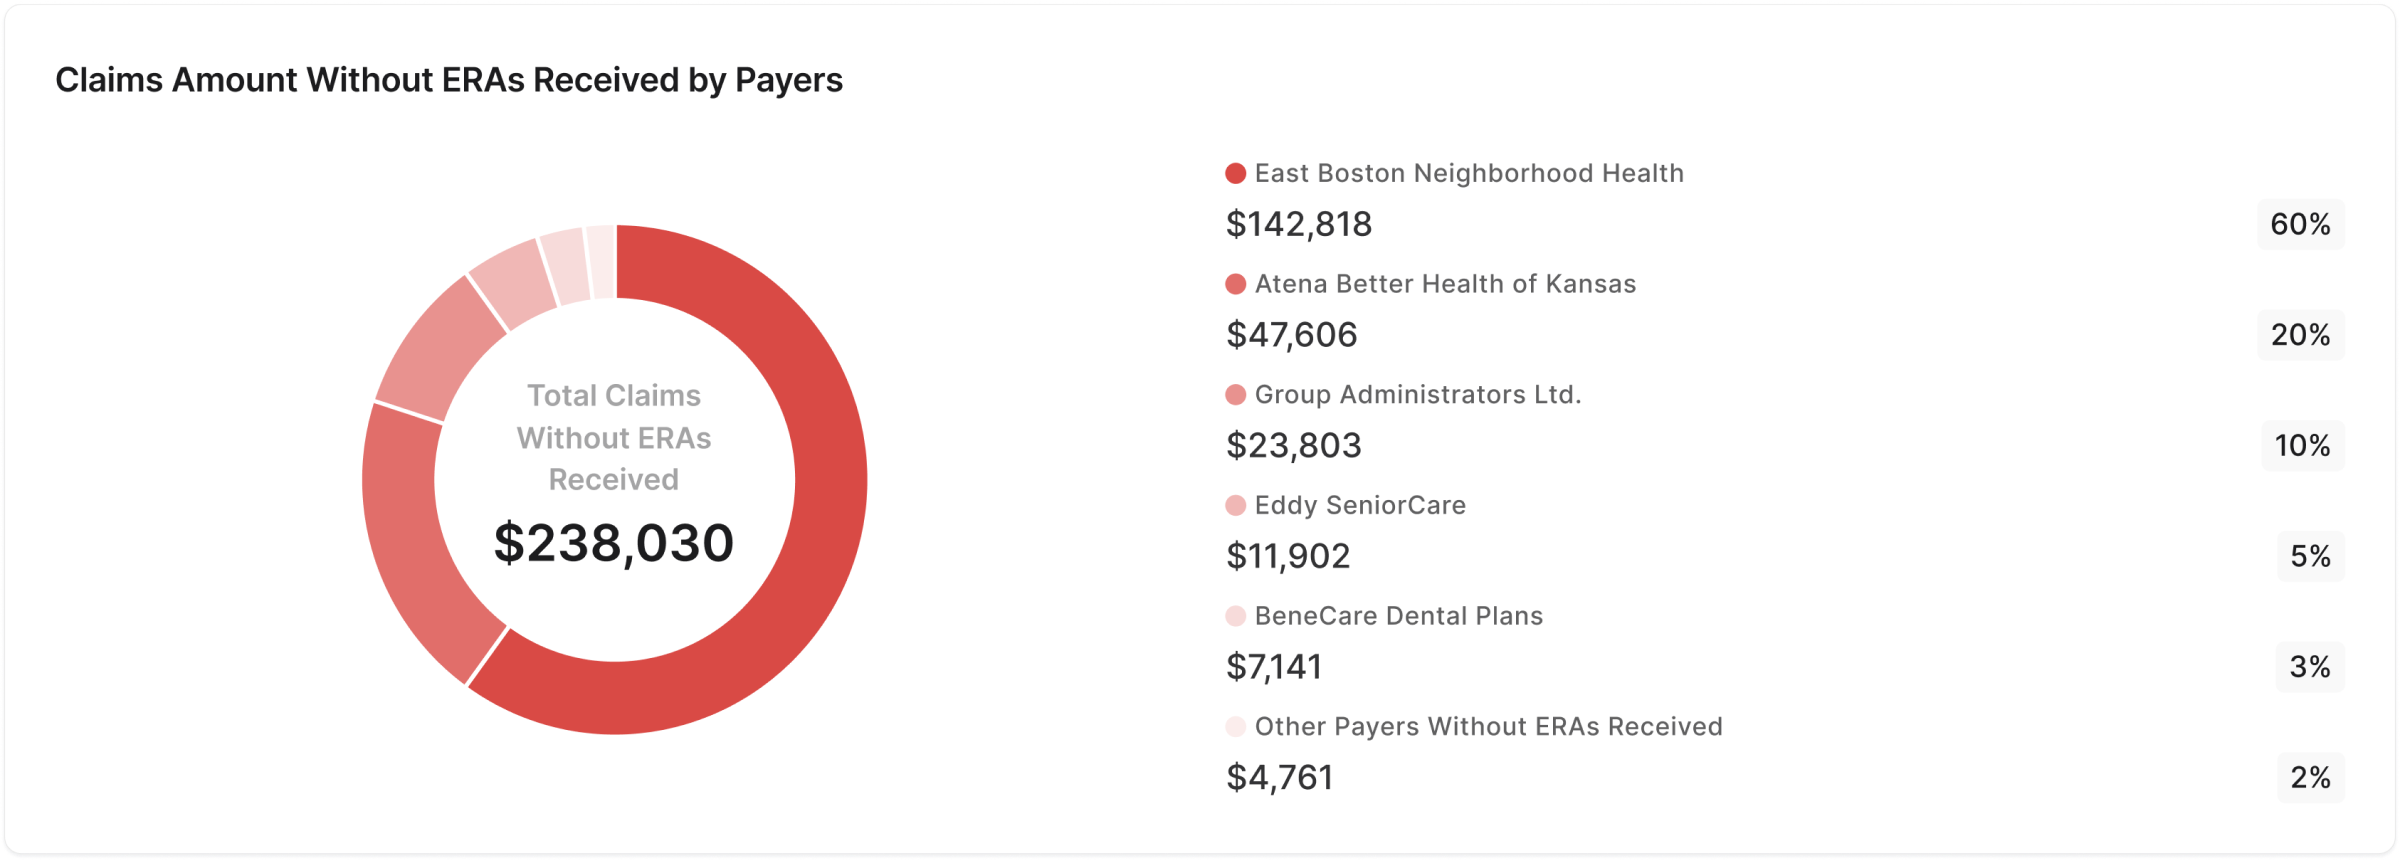
Good for: naming the payer behind a problem. Weak at: the status breakdown answers “what state are the ERAs in”, when the admin's real question is about the ERAs that never arrived.
Option 3
View by clinic
Top clinics by ERAs received as a bar chart and a sortable list, with two distributions showing each payer's share of files and of dollar amount.
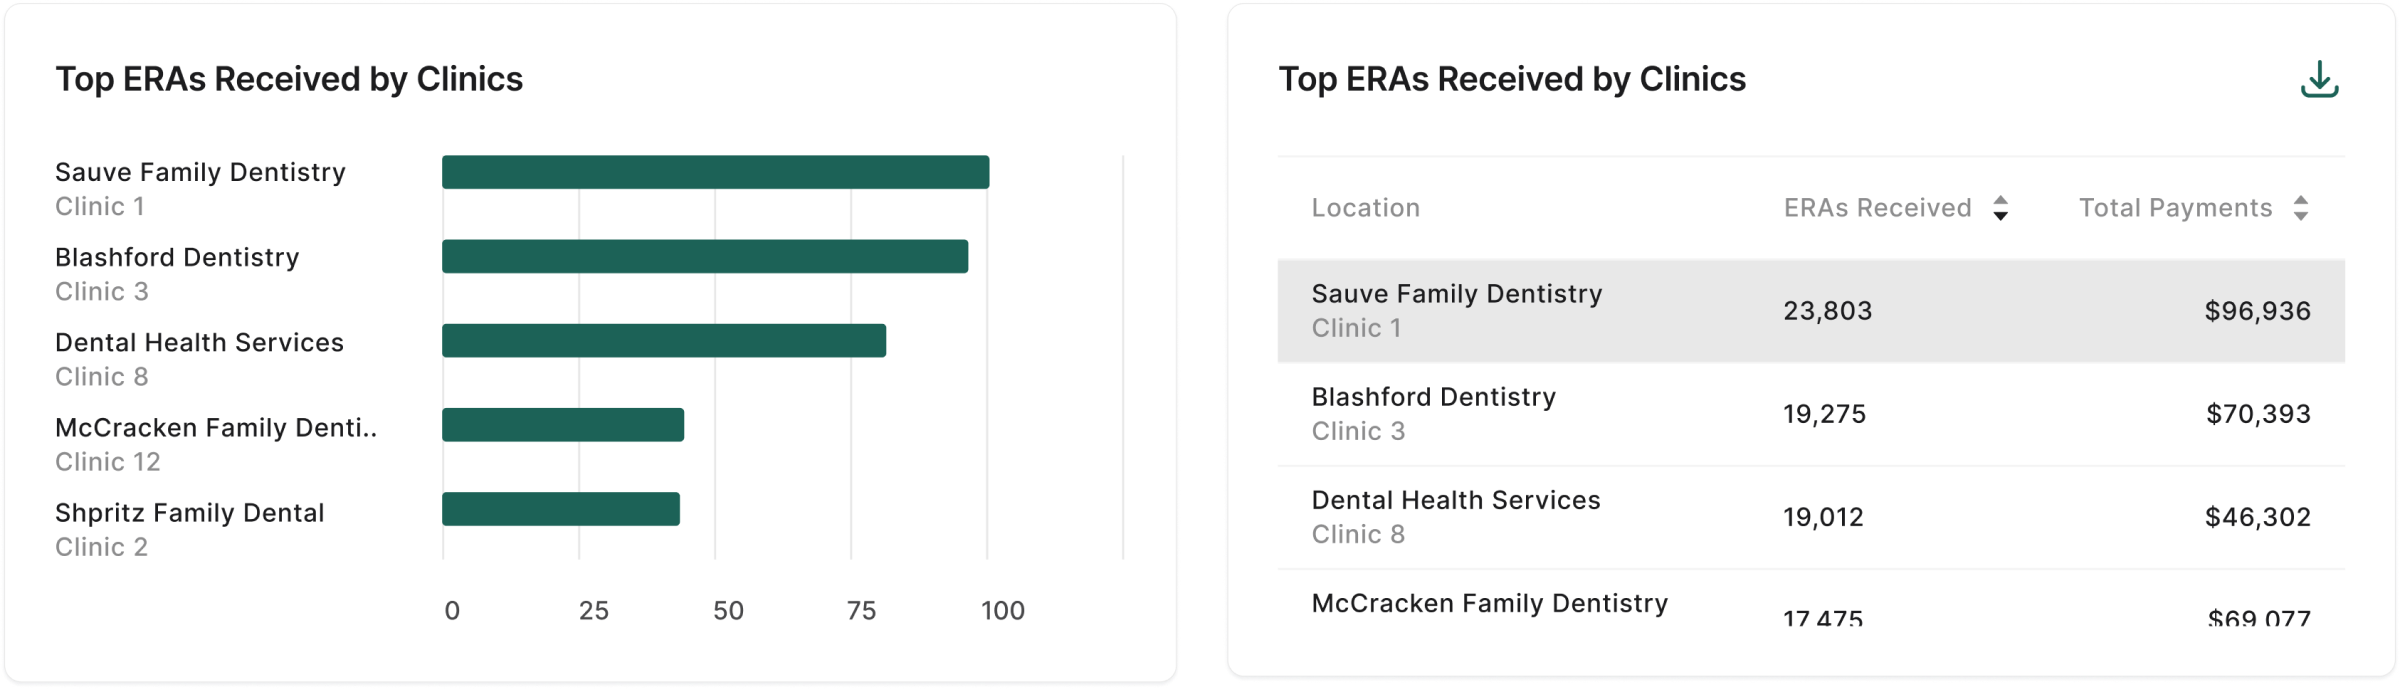
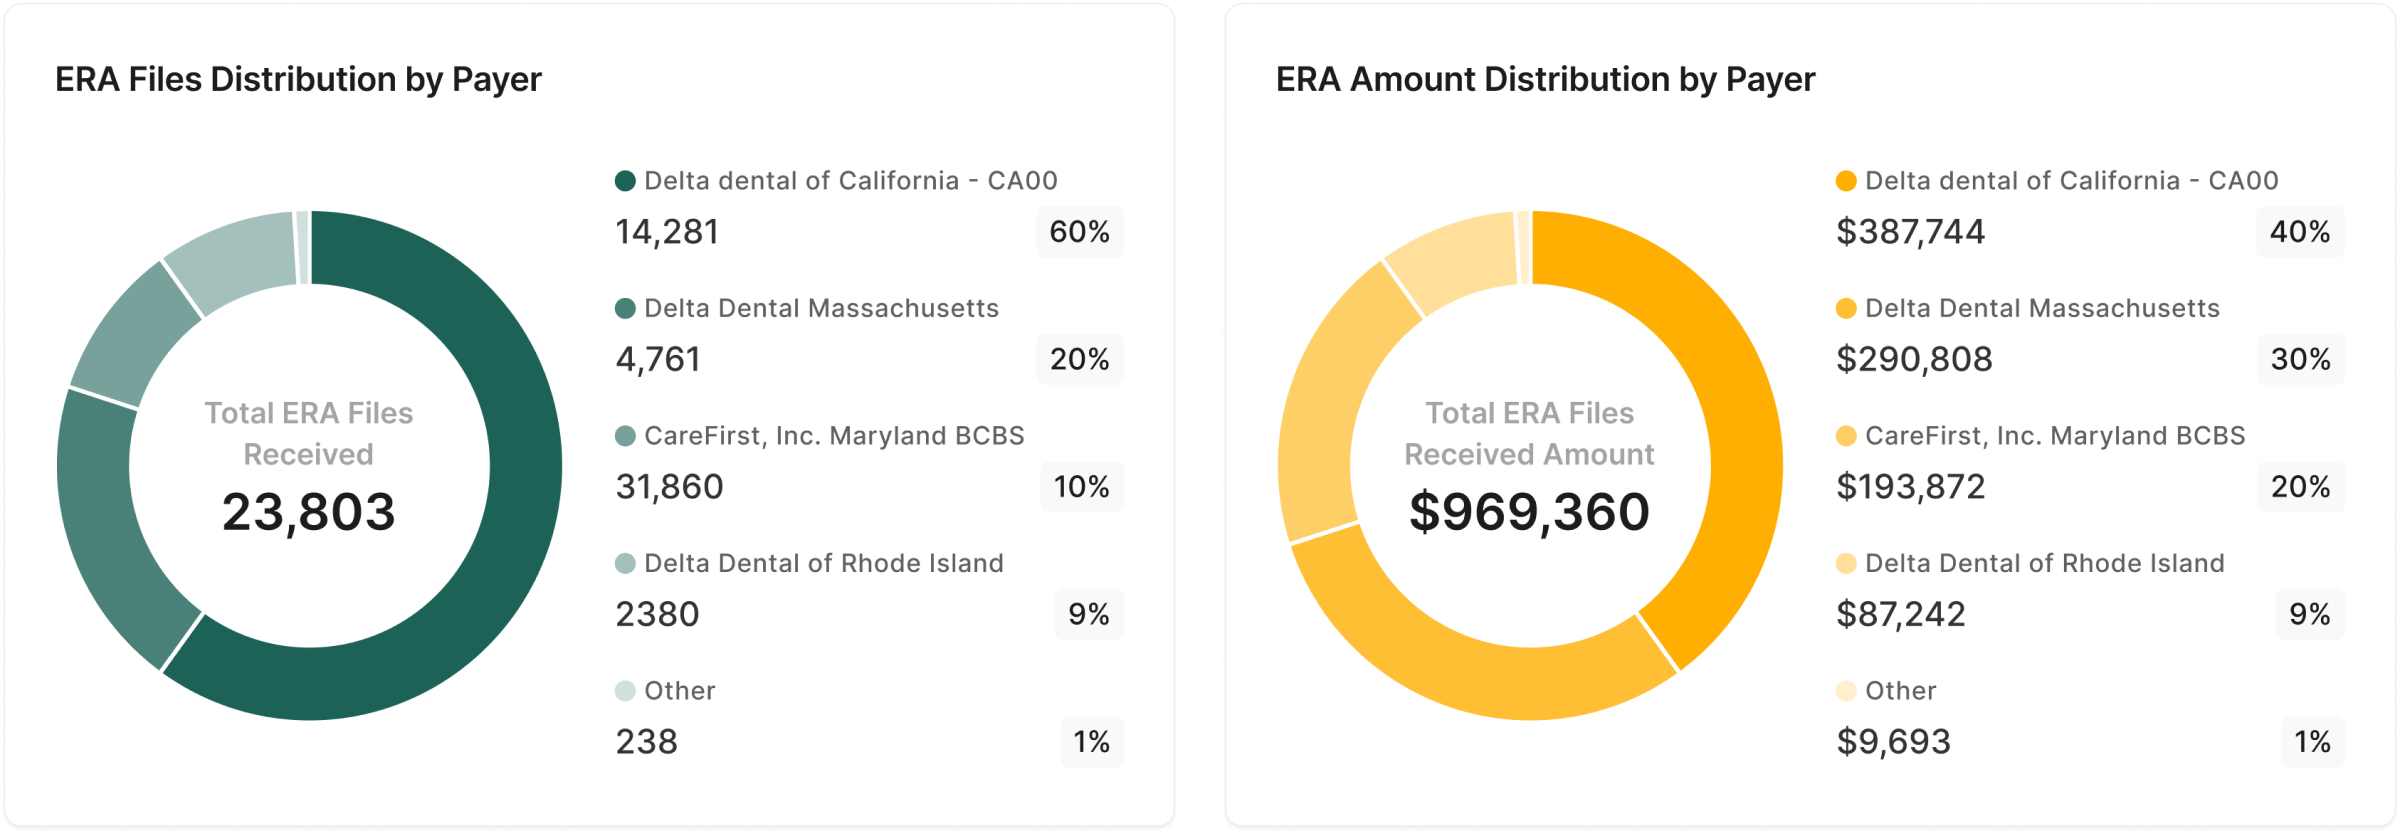
Good for: seeing where the money is concentrated. One payer can be 60% of the files and only 40% of the value. Weak at: a clinic view shows where it hurts, not who can fix it.
The decision
Why we shipped only the payer view
I had designed for broad visibility across all three lenses. Stakeholder and product feedback narrowed it to one. Their argument: every claim and every ERA traces back to a payer, so payer problems are the ones to solve first.
It was an unexpected turn, and it meant setting finished work aside. Looking back, I'd put the reasoning this way. The time view says that something is wrong. The clinic view says where it hurts. The payer view says who to chase, and that's the only one an admin can act on directly.
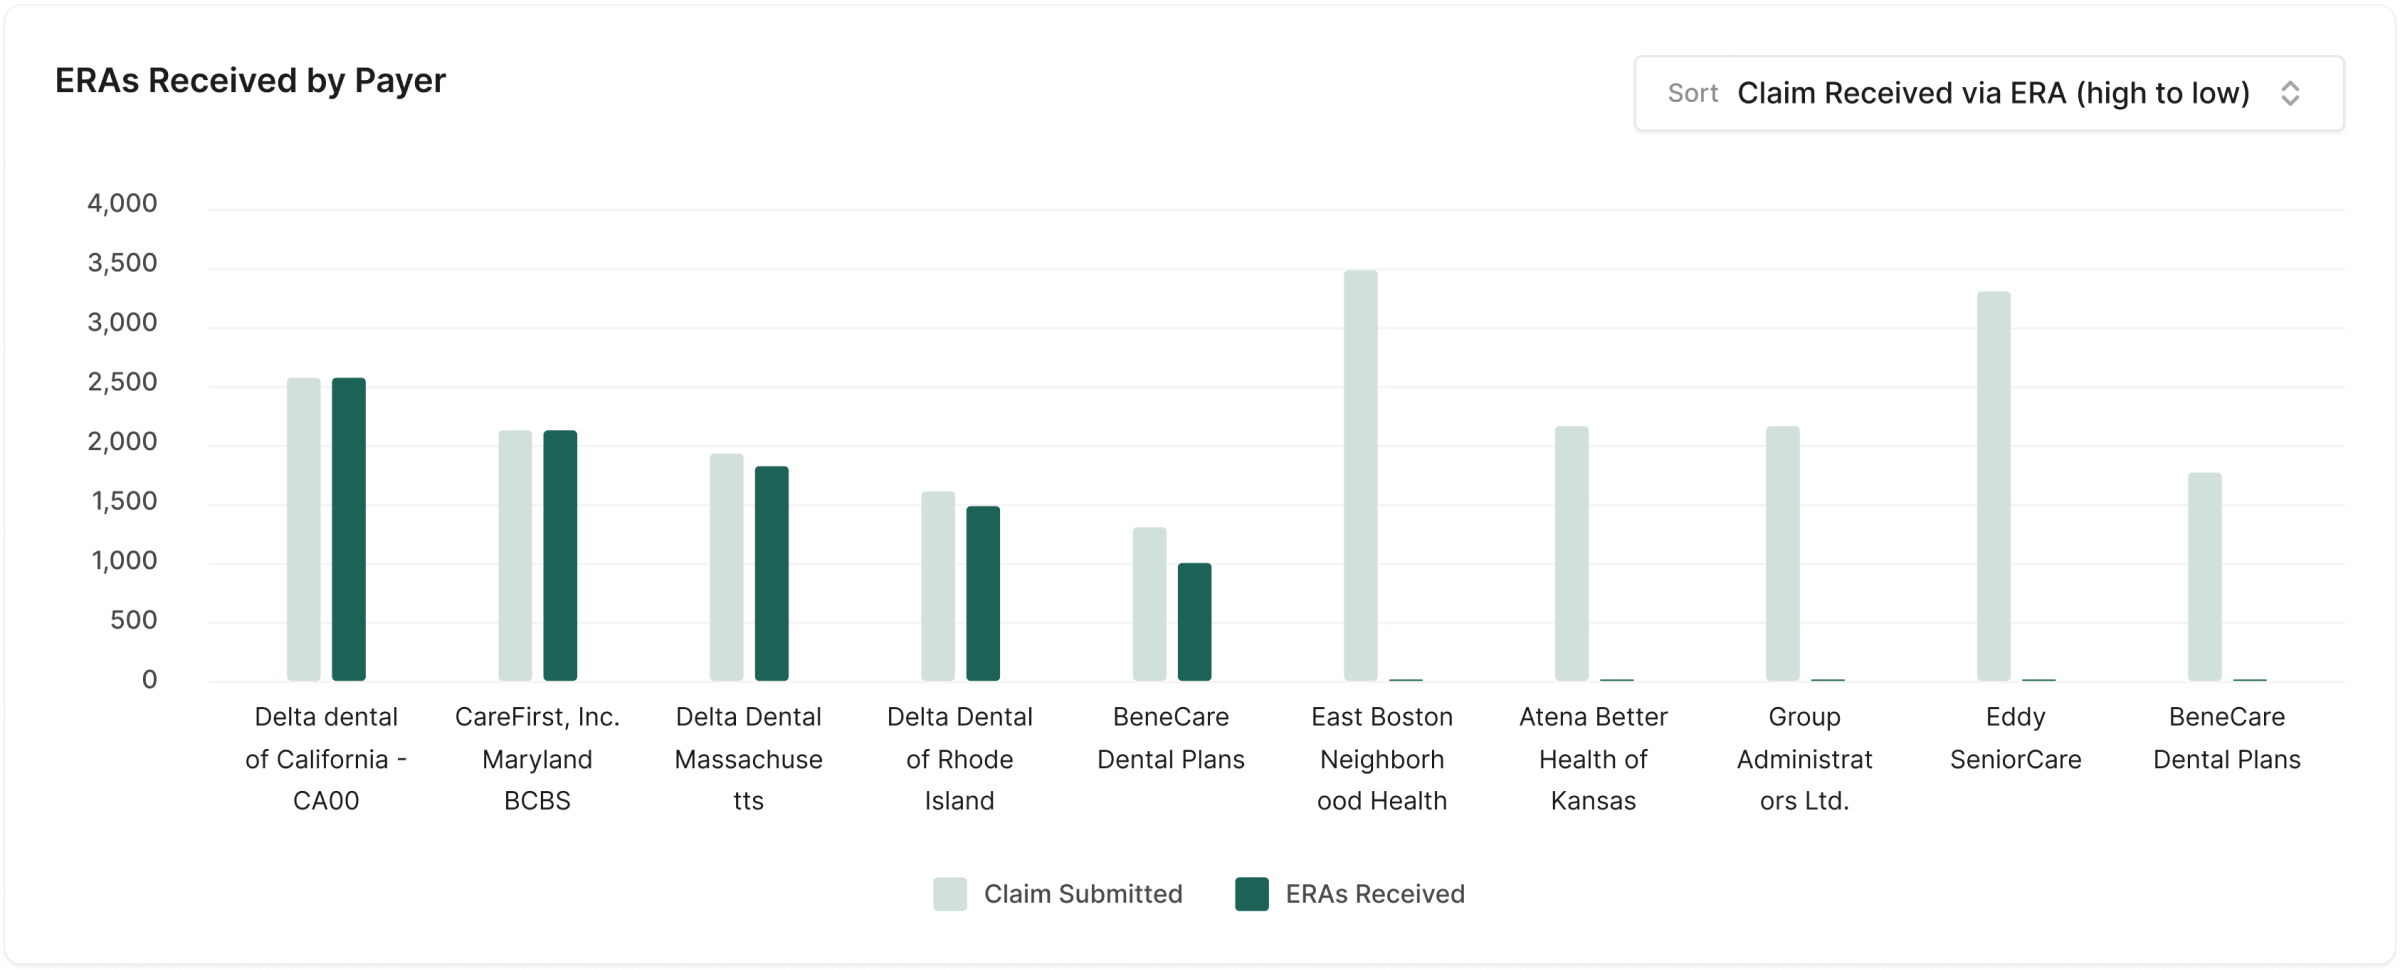
Narrowing the scope also sharpened the chart. A status breakdown was no longer the point. The point was a single comparison: claims we sent, against ERAs we got back.
Final design
A chart built around the gap
Bar inside a bar
For each payer, a light green bar shows claims submitted. A dark green bar inside it shows ERAs received. When the dark bar fills the light one, that payer is up to date. Any light green left showing is claims still waiting.
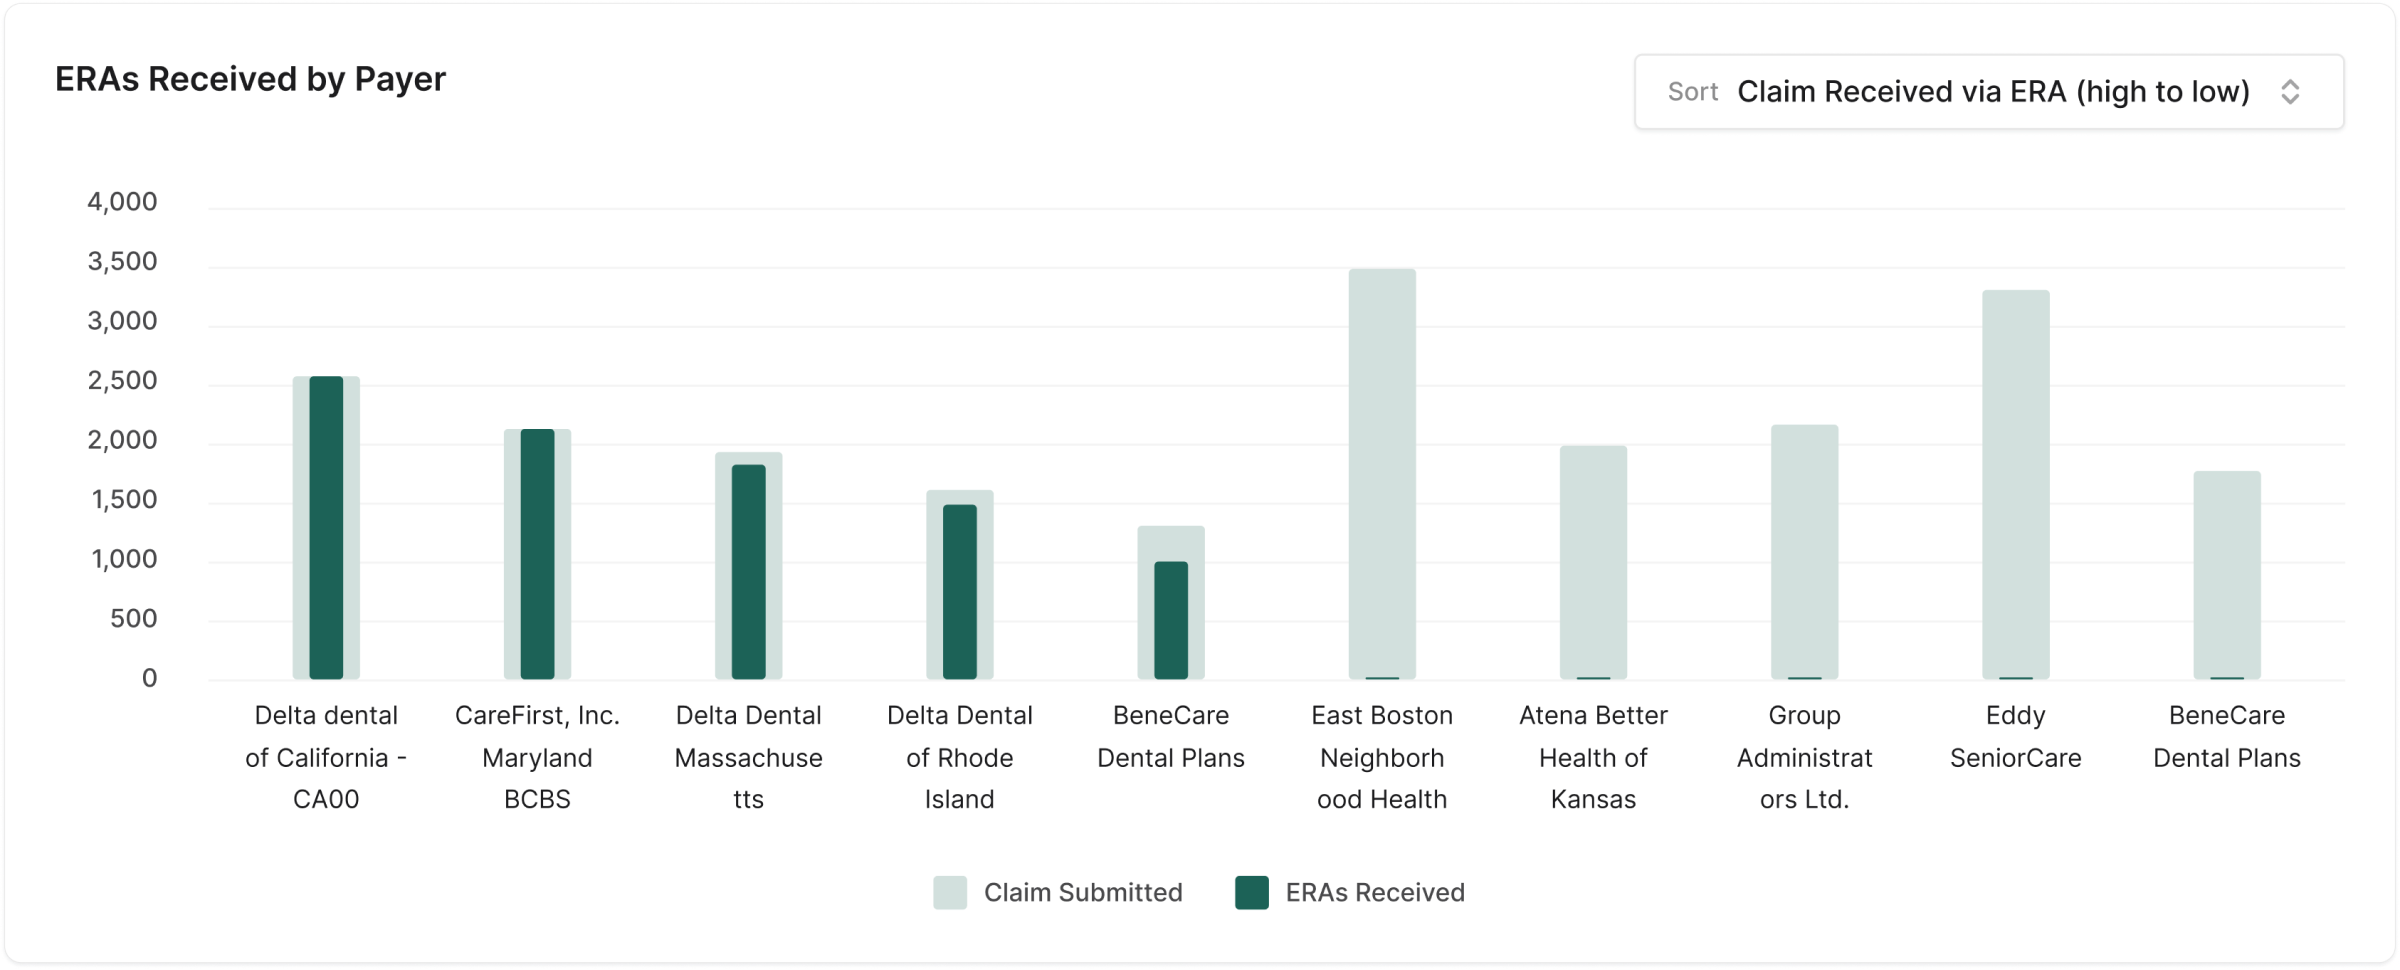
I chose this over a standard stacked bar deliberately. In a stacked bar, segments add up to a total. Here the two values don't add up: ERAs received is a portion of claims submitted. Nesting one bar inside the other shows that relationship, and it makes the unfilled part, which is what the admin is looking for, the most visible thing on the chart.
A payer list in three tiers
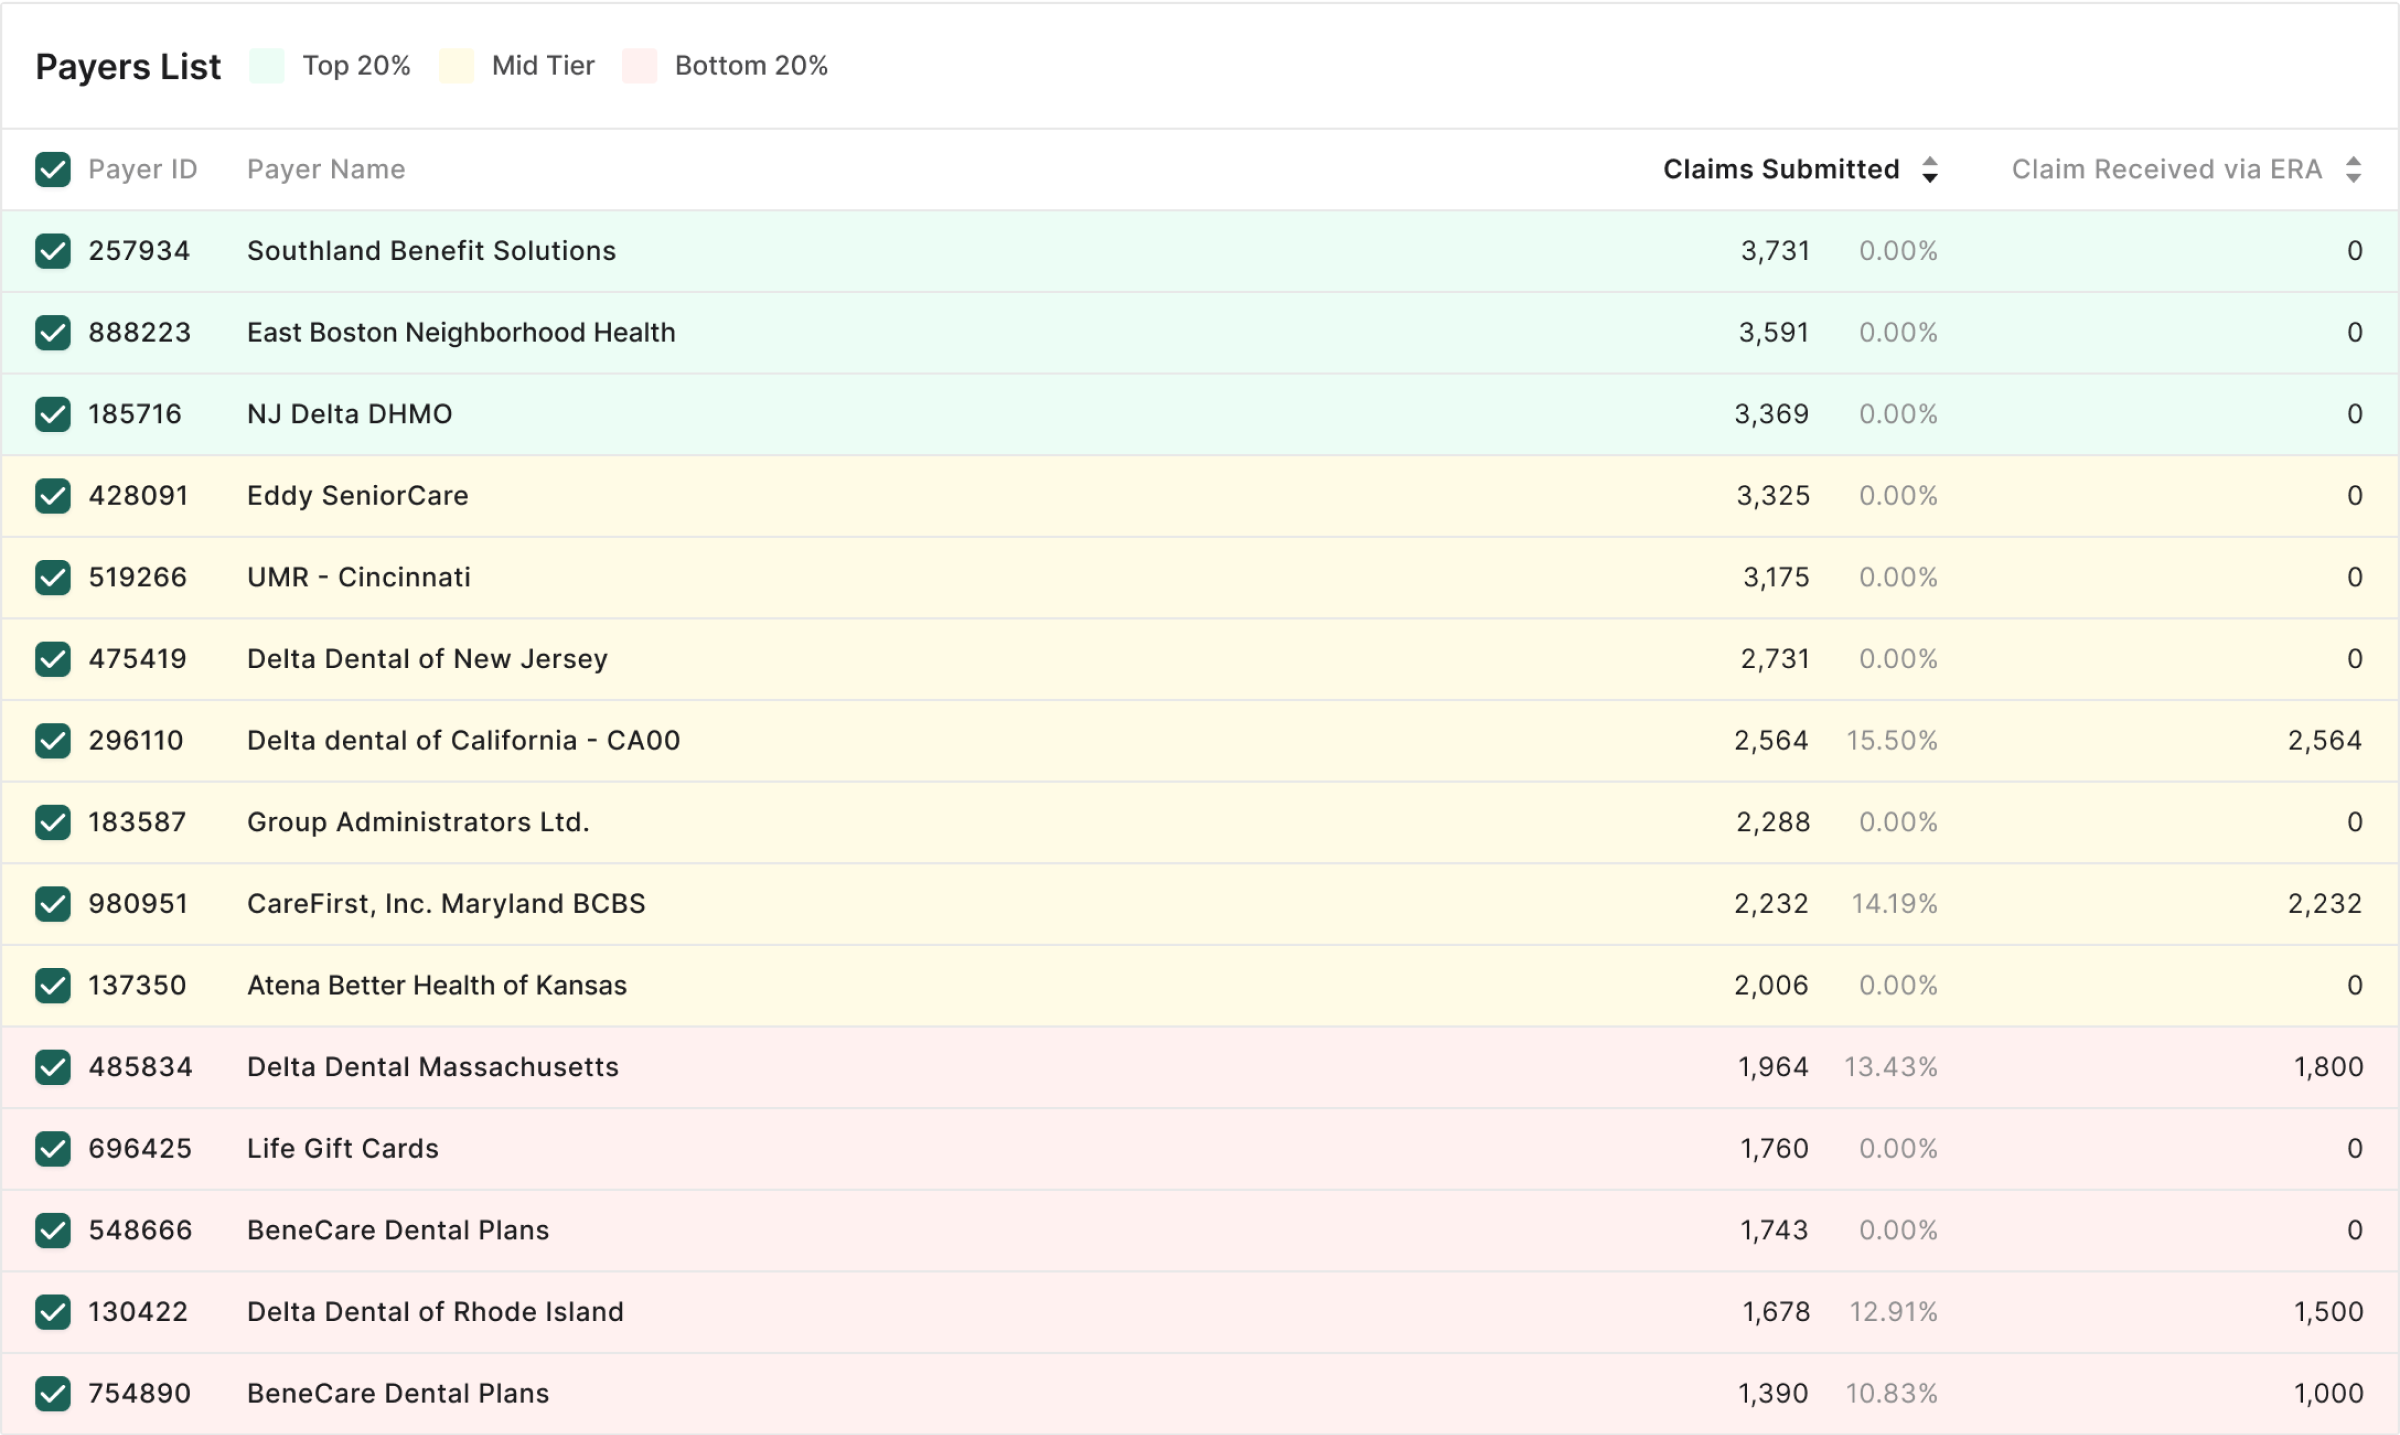
Below the chart, every payer is a row. Background colour marks the top 20%, the middle, and the bottom 20%, so the rows that need attention read as a block before any number is read. Columns sort, which puts the extremes at the top and bottom of the list where they're easiest to find. Rows expand for detail.
In use
Three questions, one list
1 · Which payer do we send the most claims to?
Sort by claims submitted. The light green bars rank the payers by volume, and any bar that isn't filled is a payer with responses outstanding.
2 · Which payer sends back the most ERAs?
Sort by ERAs received. The dark green bars show which payers are most active and most responsive, which helps decide where staff time goes.
3 · Which payer is sitting on the most claims?
Sort ERAs received from low to high. Payers with the largest unfilled bars rise to the top. This is the list of who to chase.
Measuring it
How I'd measure success
The dashboard shipped without a baseline of how long these questions took to answer before, so I won't put a number on the improvement. These are the signals I'd set up if I were doing it again.
| Signal | What it tells us |
|---|---|
| Time to name the payer with the largest gap | A timed task, before and after. This is the dashboard's core job. |
| Claims without an ERA after 30 days | The outcome that matters. If admins are chasing the right payers, this number falls. |
| Sort and expand usage | Whether people use the list to investigate, or only look at the chart. |
| Weekly returning admins | Whether it has become part of the routine or was opened once. |
Reflection
What I'd do differently
Talk to admins first
Requirements reached me through product and stakeholders. I'd start with the admins themselves and ask what they do after they spot a problem payer, because the dashboard should lead into that next step.
Ask the question before drawing the views
I designed three lenses and then learned which one mattered. A short session on “what decision does this screen support?” would have got us to the payer view sooner.
The time and clinic views weren't wasted. Working through them is how I understood the data well enough to see that the gap was the story. The same thinking carries to other monitoring problems, such as claim submission.